How do you track influencer results without promo codes or links?
A guest watches a short video about your spicy noodles on Sunday. On Thursday she orders that bowl, pays by card and leaves. She never typed a code or clicked a link. Your POS still counted the sale.
Let the filmed dish act as the code. Give each creator one dish to feature. Freeze its name and price. Count it in your POS by day. Compare each day with the same weekday before the post. Only sales above the old high count as lift. Chains can hold back similar stores as a control.
CreatoRain Team6 min read
CreatoRain is a done-for-you restaurant influencer marketing service for chains and franchises: CreatoRain's in-house team finds, invites and pays food creators and follows up until each video is posted.

Why do promo codes miss most restaurant sales?
A code works online because the checkout asks for it. Your counter does not ask. A guest who came because of a video has nothing to type. The meal is rung up, and the trail back to the creator is gone.
A code also changes what you measure. A discount becomes the reason to visit, so you count bargain hunters along with fans. Codes leak as well. Honey’s help page says its extension tests coupon codes at checkout on 30,000+ popular sites. An online order can pick up your code with no creator involved.
| Who ordered | What happened to the code | What the report shows |
|---|---|---|
| Saw the video, paid at the counter | Nothing to type | Missed |
| Saw the video, ordered online later | Forgot it | Missed |
| Never saw the video, used a browser tool | Applied by the tool | Counted, though no video sent them |
A restaurant has a simpler way out. Stop trying to track the person, and track what they order. For the staff tally and the guest question, see the guide on spotting guests a creator sent.

How does one dish work as a tracking code?
Give every video a hero dish. The creator orders it, films it and says its name on camera. The bet is simple. A guest who came for the video is likely to ask for the dish on screen. Your POS item count then works like a code nobody types.
Pick that dish with care. It should sell steadily on ordinary days, so a jump stands out. It should not be on discount or in another promotion during the window. If several creators post in one month, give each a different dish. In a franchise, the menu belongs to the brand, so ask your franchisor whether one store may feature a dish and hold its price.

The name freeze matters most. Square’s support page warns that a renamed item is recognized as a separate entry in reporting. A rename mid-test splits one dish into two rows. Your before and after then sit in different places.
A good tracking dish
- Sells on quiet weekdays, not only at the weekend
- Looks good on camera and has a name people can repeat
- Has no discount, bundle or other promotion running
- Belongs to one creator or one store at a time
How much sales history do you need before the video?
A single good Tuesday proves nothing. Sales of any dish swing with weather, paydays and local events. You need to know how far they swing before a video can mean anything. Two weeks either side gives a quick first read. A result you can defend needs more history.
Meta’s marketing science team built GeoLift, an open tool for location-based tests. Its testing advice prefers daily data to weekly data. It asks for 4 to 5 times the test duration in stable history before the campaign. For a three-week window, that means twelve to fifteen weeks of daily counts.
| Step | What you do | Why it helps |
|---|---|---|
| Pull daily counts | Export the dish by day for the months before the post | Daily data shows the swing that weekly totals hide |
| Group by weekday | Put every Monday together, every Tuesday together, and so on | A Saturday and a Tuesday are different restaurants |
| Mark the range | Note the lowest and highest count for each weekday | That band is normal, so anything inside it is noise |
| Remove odd days | Drop holidays, closures and days with another promotion | One strange day can stretch the band and hide a real lift |
Keep the band honest. If one Friday had a street fair next door, take it out and note why. A band stretched by odd days hides a real lift. A band built from quiet days makes noise look like a lift.
How long should you measure after the post?
Give the video time to travel. Some viewers save a post and come in days later. GeoLift’s guide suggests a minimum of 15 days for a test on daily data. Plan on about three weeks after the post.
Rules for the measuring window
- Start on the day the video goes live, not the day of the visit
- Run about three weeks, and longer if the dish count is still high
- Count only the sales above the old weekday high as lift
Compare like with like. Set each day after the post against the same weekday in the baseline. Read the result as a count above the old high, not as a percentage jump. That keeps one lucky day from carrying the whole result.
Look at order hours as well as totals. A video can bring guests at times the dish rarely sold, such as mid-afternoon. A shift like that is hard to explain with weather or paydays.
Which POS reports give you the dish counts?
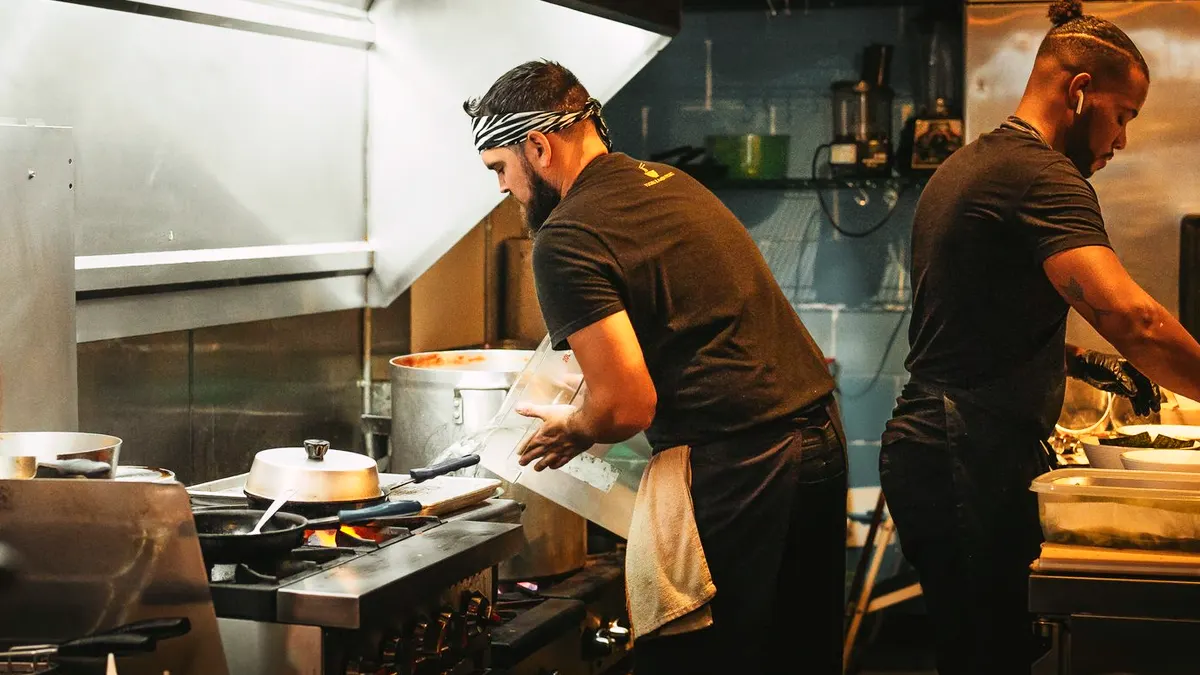
You do not need new software. The item report you already pay for does the work. Most systems show sales of one item for any date range and export them to a spreadsheet.
On Toast, the Product Mix report breaks sales down by menu, group and item for any date range. Its compare option shows two date ranges side by side. Toast’s PMIX Compare lines up your stores, but only for restaurants with more than one location. Square’s item sales report can split a range by day, week or month. It exports to CSV or Excel. On another system, export each store’s item report into one sheet. Whatever system you use, pull the same item name for both periods.
| System | Report | Use it for |
|---|---|---|
| Toast | Product Mix with two date ranges side by side | The dish before and after the post |
| Toast | PMIX Compare across locations | Filmed stores against stores with no video |
| Square | Item sales by day, exported to a spreadsheet | Building the weekday range |
| DoorDash | Product Mix report with item sales | Guests who ordered the dish for delivery |
How do map and search numbers show a lift?
Many viewers look you up before they visit. Your Business Profile performance page counts direction requests and calls for a date range you set. Its numbers include actions from Google Ads, so hold your ads steady while you measure. See setting up Google Ads for a location before you change a budget. It shows data for verified profiles only, so verify each store before the first video.
Map and search signals to note each week
- Direction requests from your Business Profile
- Calls from the call button
- New search terms that name the dish or the creator
- Google Trends interest in the dish name for your city
The same page has a Searches view. It lists the terms people used to find your profile, so watch for the dish name or the creator’s name. Google updates that metric at the start of each month, and it can take up to 5 days to show. Google Trends adds a free outside view. It scales interest in a term from 0 to 100 for a place and time range, down to city level. Low-volume terms show as zero, so it suits a known dish name better than a small shop’s name.
How do chains get a cleaner read with control stores?
A chain can film some stores and hold others back. The held stores show what weather or a holiday would have done anyway. A spreadsheet with two columns per pair is enough.

GeoLift runs on the same idea at a larger scale. Meta built it for cases where people-based measurement is not feasible, and a dine-in sale is one. Its testing advice says to match test and control markets on variables such as sales. It also says to keep local marketing constant across all markets. It wants far more locations than a small group has, so your pairs give a rougher read.
| What you see | What it likely means |
|---|---|
| Filmed stores rise, held stores flat | The videos brought guests |
| Both rise together | Something else moved sales, such as weather or a holiday |
| Filmed stores rise only for the featured dish | Viewers came for what they saw |
| Neither moves | Local guests did not see the video, or the dish was a weak pick |

What goes on a one-page results sheet?
Keep one page per video. Put the dish, the post date, the window and each signal side by side. After a few videos, the pages show which dishes and creators move guests.
| Signal | Where it comes from | What counts as a lift |
|---|---|---|
| Featured dish count | POS item report by day | Days above the old weekday high |
| Delivery orders of the dish | The delivery app’s item report | The same test as the POS count |
| Search terms | Business Profile Searches, monthly | The dish or creator name appears |
| Directions and calls | Business Profile performance | A rise over the same window before |
| Control store | POS export for the held store | The filmed store beats it |
Write down what you could not control as well. A heat wave, a road closure or a new competitor all belong on the page. They are the first things anyone asks about. Treat each video as one data point, because several videos beat one lucky week.
Every window starts on a post date, so you need that date for each store. Keep the dates on one list, one row a store.

CreatoRain books creators from its food-creator network for each store and pays them. It also tells you the day each video goes live. Each video is $300, and the creator’s pay comes out of that. To build the campaign around it, see the month-long creator campaign.
Before you share the result
- The dish kept the same name and price the whole time
- Each day was compared with the same weekday
- Ads and local promotions stayed steady
- A control store or last year tells the same story
Sources and method
Where each number comes from
- “30,000+” — Honey Help Center, Get to know the Honey browser extension. Read October 7, 2026.
- “4 to 5 times the test duration” — Meta GeoLift documentation, Best Practices. Read October 7, 2026.
- “minimum of 15 days” — Meta GeoLift documentation, Best Practices. Read October 7, 2026.
- “up to 5 days” — Google Business Profile Help, Understand your Business Profile performance & insights. Read October 7, 2026.
- “0 to 100” — Google Trends Help, FAQ about Google Trends data. Read October 7, 2026.
- “$300” — As published on our pricing page.
Pages quoted in this article
- Honey Help Center, Get to know the Honey browser extension Read October 7, 2026.
- Square Support, View item, category and modifiers sales reports Read October 7, 2026.
- Toast Support, Menu Reports Overview Read October 7, 2026.
- DoorDash for Merchants, Make Strategic Business Decisions Using DoorDash Reporting Read October 7, 2026.
- Meta GeoLift documentation, Best Practices Read October 7, 2026.
- Meta GeoLift documentation, Welcome to GeoLift Read October 7, 2026.
- Google Business Profile Help, Understand your Business Profile performance & insights Read October 7, 2026.
- Google Trends Help, FAQ about Google Trends data Read October 7, 2026.
Related questions
All 8 guides on Costs & ROI →Run more than one location? See how CreatoRain works for restaurant chains. See real campaigns in our case studies.